Dashboard for IoT-enabled Water Service Delivery Measurement and Monitoring Sensing System for Rural Deployment
TRL level:
Technology Demonstration (TRL-4)
Executive Summary/Description of the software
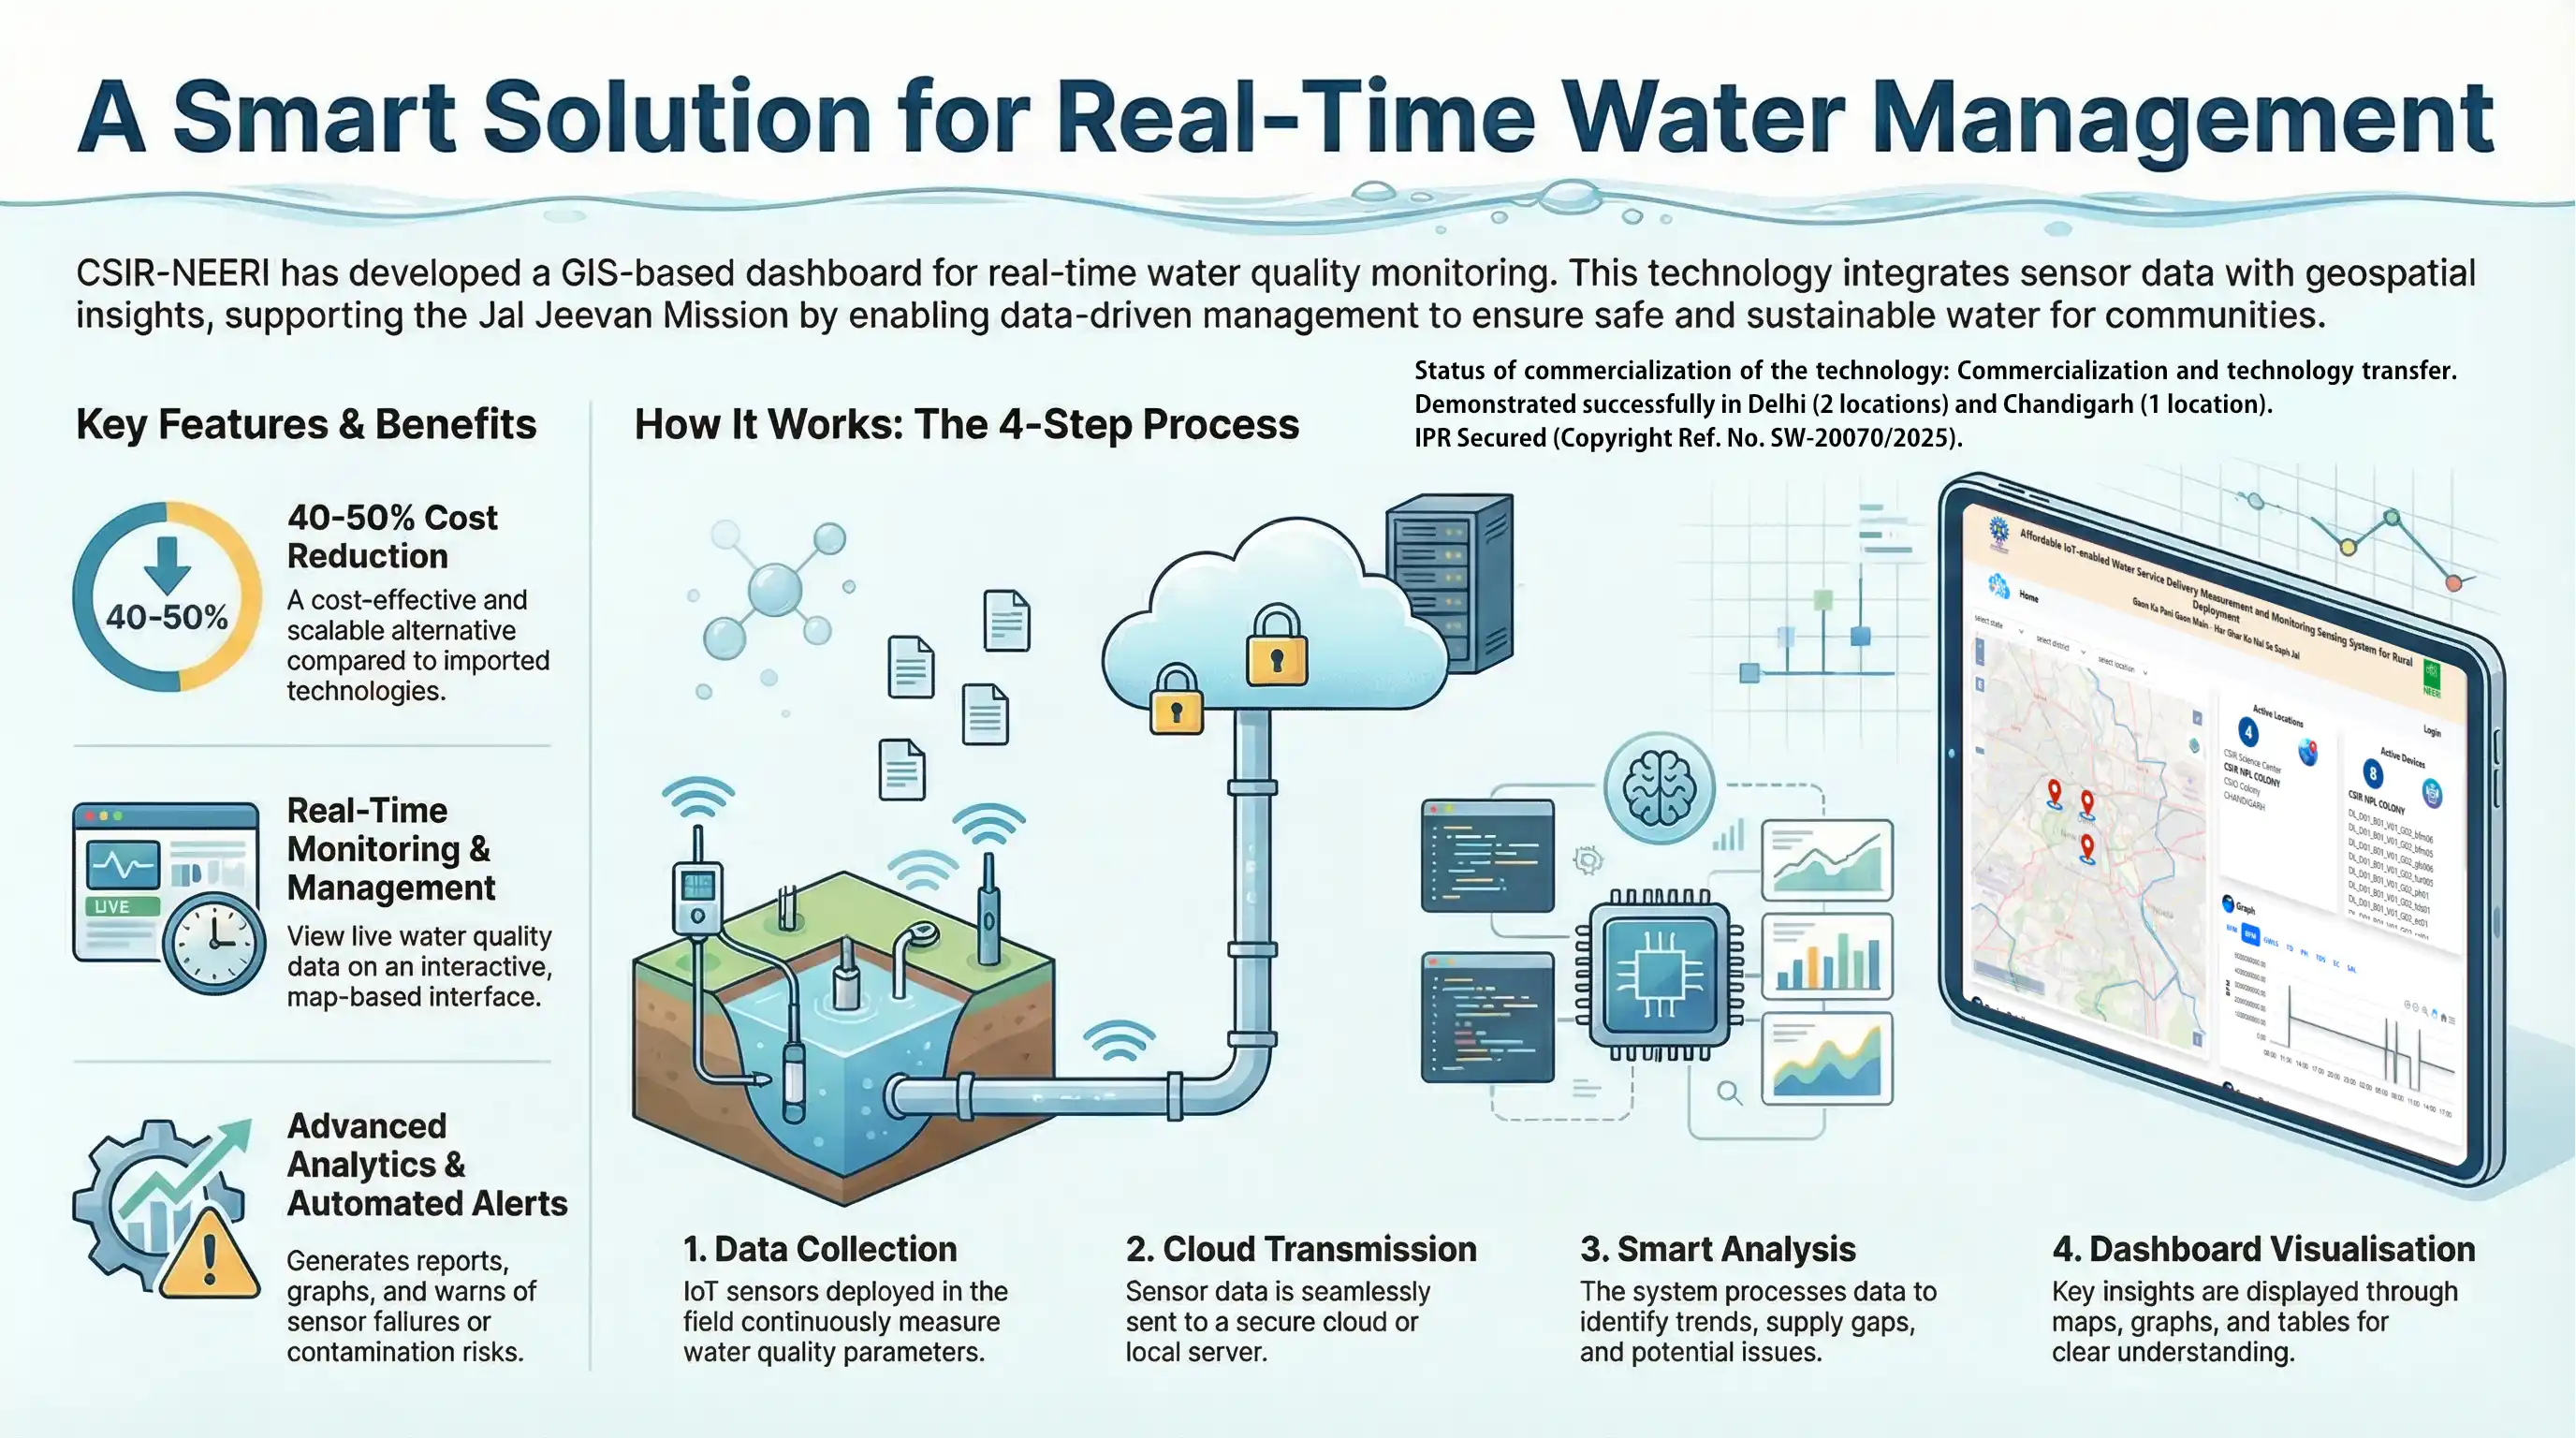
CSIR-NEERI's development of a live water sensor data dashboard represents an innovative interdisciplinary approach. The GIS-based portal integrates metadata, sensor data, and geodata to offer interactive insights. It incorporates manual data from field testing kits and water quality assessments, integrating them through in situ devices. Customized for various administrative levels, from central to household, the dashboard aims to provide real-time water quality information. This initiative underscores a commitment to cutting-edge research and aims to enhance water management practices with comprehensive data visualization and accessibility.
Salient Technical features
Dynamically add/delete/update water sensor data and its location.
Show near live sensor properties and values on the dashboard.
Dynamic generates and statistically analysis sensor data and produce various graphs.
Automatically generate alarms in case of sensor failure or discontinuity in data
Utilize live sensor data to analysis water demand/supply gaps, physical conditions of water assets like pipe network and contamination in water supply lines using built-up application RISK-PiNET
Problem being addressed/Application
The system enables systematic data management of assets, providing online access to infrastructure data for uploads and downloads, facilitating informed decision-making processes. Users can upload data using OGC compliance tools, ensuring compatibility and standardization. The system stores, updates, and utilizes data for future assessments of the infrastructure, ensuring a comprehensive and forward-looking approach to system management and development.